We make it convenient for you to develop embedded applications. With CODEO you can conveniently setup your target device via the project configurator. Here, you find all the necessary tools to manage your target and your applications. The IDE grants access to target devices for remote debugging and timing analysis for runtime information. You can focus on developing outstanding embedded applications for the intelligent edge.
CODEO is flexible: You may cross-develop for target devices within Windows and testing it with QEMU.
Setup & Development Options

Setup Wizards
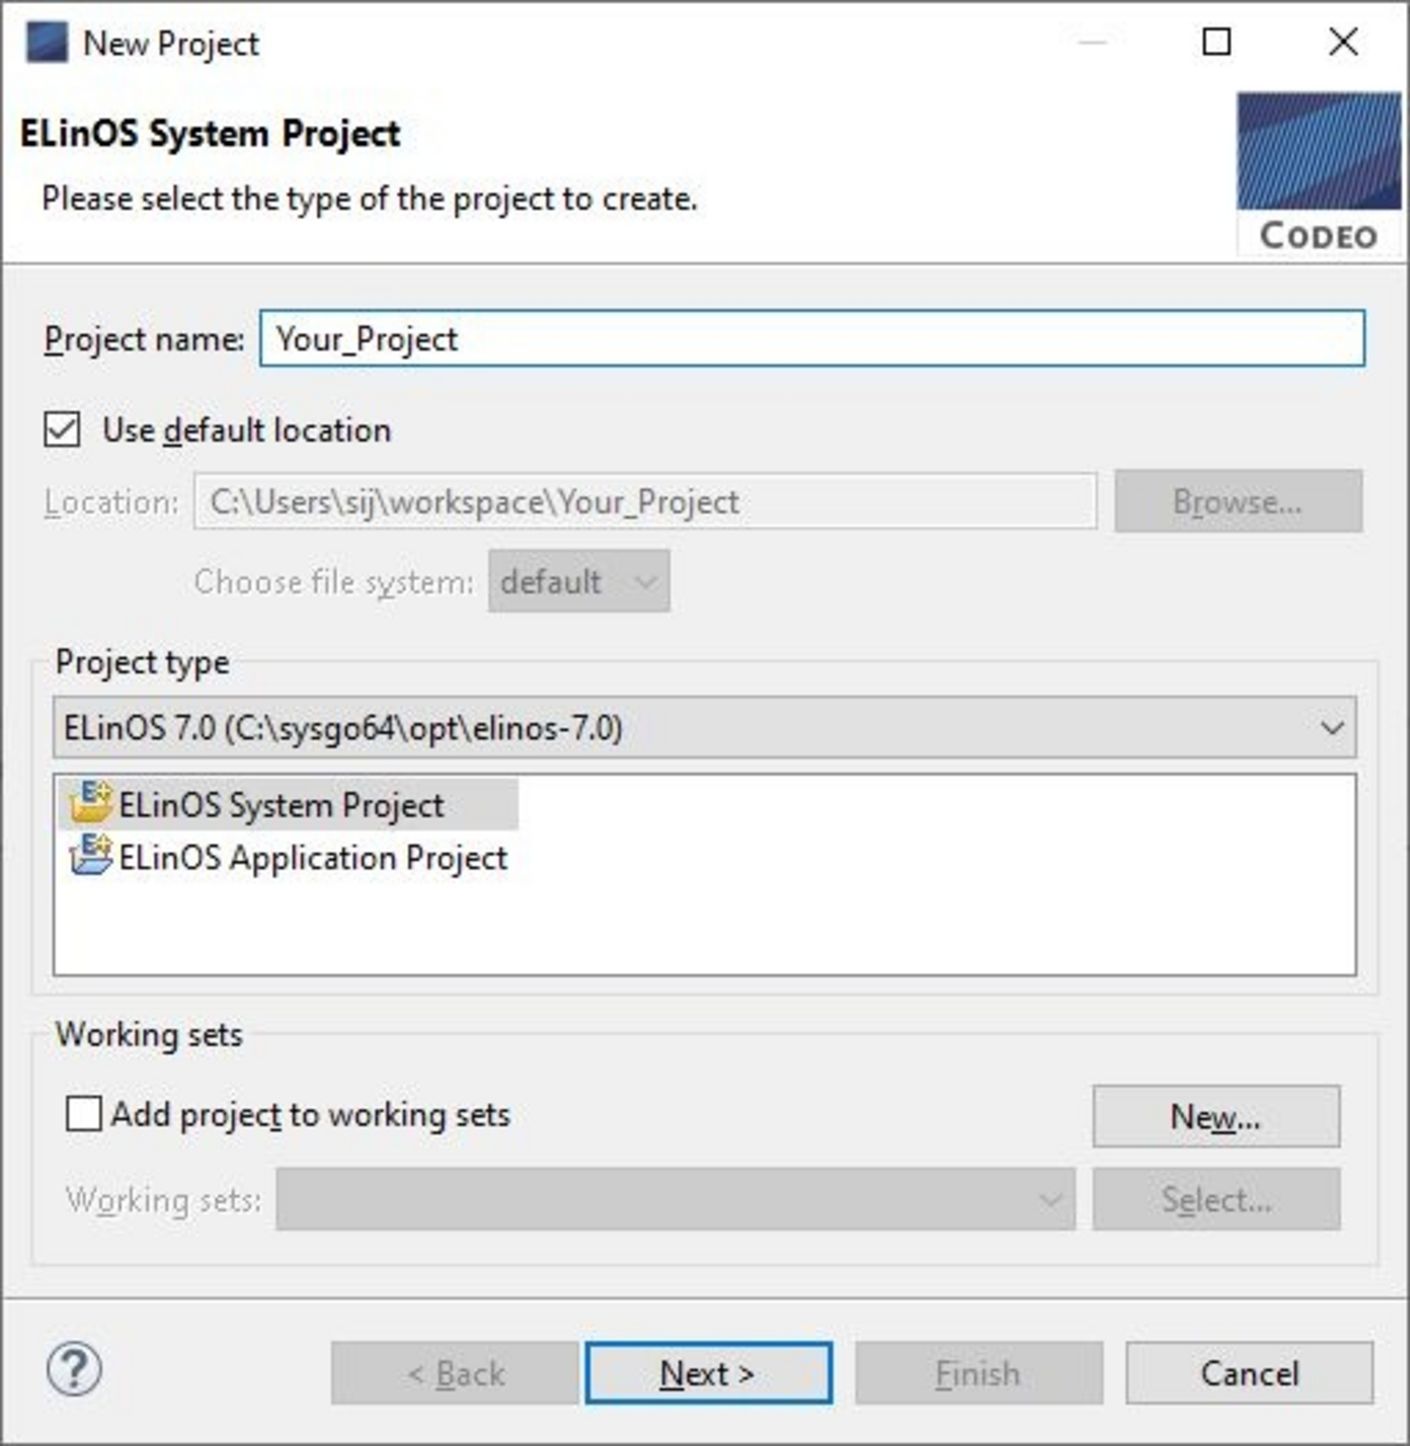
There are two types of wizards that either help to set up an embedded Linux ELinOS system for a target device or to develop an embedded application for a target device already running ELinOS.

Development Features
The ELinOS toolchain environment provides all development features to create modern embedded systems. CODEO comprises the latest GNU Compiler Collection (GCC) and Binutils and the C/C++ Development Tooling (CDT) plugin. The graphical feature and kernel configurators as well as direct access to the target file system are integrated in the IDE.

ELinOS makes use of the Eclipse C/C++ Development Tooling (CDT) plugin.
Feature Configurator
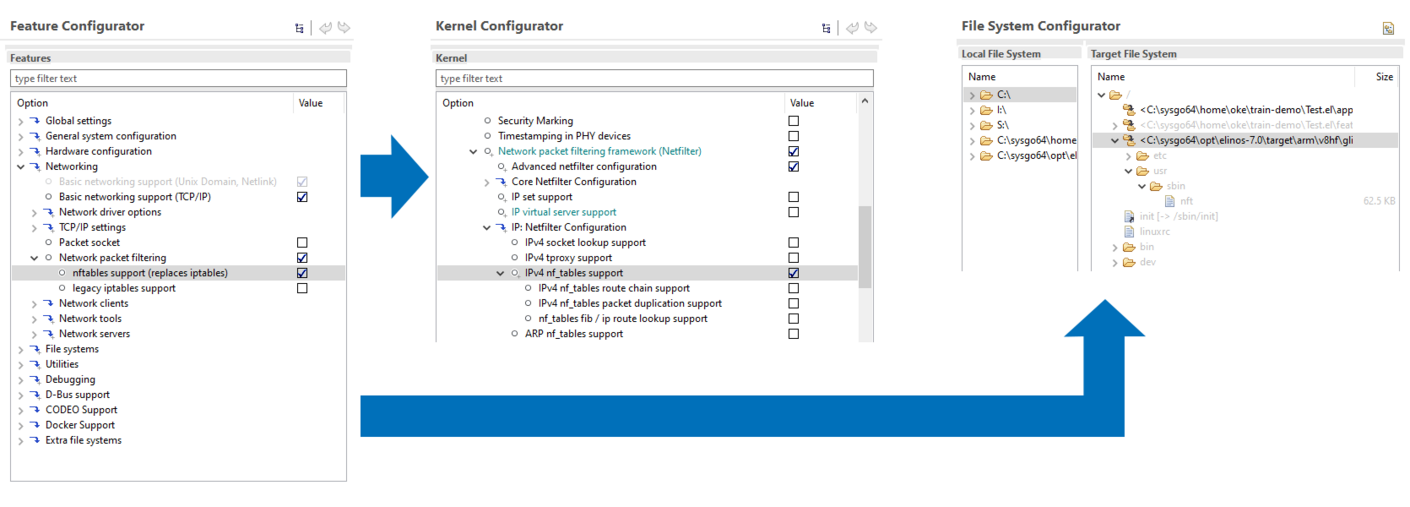
Edit the features of a system project configuration with all feature configuration options. The tree displays the features as found in the ELinOS installation and reads the current values from the project. Navigate the tree by expanding/collapsing entries and enable/disable/modify values.
Kernel Configurator
Edit the configuration of a system project containing options controlled by the Feature Configurator. The Kernel Configurator is also displayed as a tree where you can edit values, get help with hovers and use the properties view for navigation.
File System Configuration
Used to set up the target file system. It displays and modifies the MKEFS commands used for creation of the target file system in a graphical view. Only if you have very special needs you need to switch to the second tab and edit the MKEFS commands directly on a textual level.

Debugging & Analysis
For developing applications in CODEO, several tools are provided to trace and analyse application behaviour during runtime,
monitor system resources and remote debug software on the target system.

The ELinOS toolchain comprises among other QEMU, perf, LTTng, GNU project debugger (GDB) and Valgrind for testing and debugging. The broad variety of tools help examine application functional behaviour diversely.
QEMU sets embedded software developers in the place to set up and run an embedded Linux instance in the development host environment. This makes it more comfortable for developers to build, test and debug a system without the need to deploy software onto a real target. QEMU supports network features.

With perf embedded systems can be evaluated regarding their performance. Perf helps identifying and erasing bottlenecks, thus speeding up embedded systems.
Valgrind is a framework that comes with debugging and profiling tools that – among other functionalities – help prevent erroneous code (e.g., buffer overflows).
Linux Trace Toolkit Next Generation (LTTng) supports developers in finding bugs that are otherwise hard to identify.

For analysis purposes the System Viewer tool is available. It sets you in the place to monitor system resources while running ELinOS on a target system (real or virtualized). System Viewer provides information on basic system setups such as architecture, kernel version and system time and general information on interrupts, processes, IO memory and ports with name and address spaces, loaded kernel modules and used system memory. Furthermore, it shows currently used inter-process communication pipes, active semaphores, shared memory, message queues and used sockets.
