The CODEO IDE provides a user-centric experience by means of perspectives that provide the right tool for every step of your building process. The entire development process takes place in so called workspaces that host different kind of project types. PikeOS and PikeOS for MPU projects can used in the same workspace at the same time. This is particular interesting for big System-on-Chips (SoCs) with heterogeneous processor cores.
Setup
Kick-start your project by selecting your BSP in a guided graphical wizard.
You can start with an empty project or with one of our demos which range from simple hello world applications to complex systems with multiple guest operating systems.
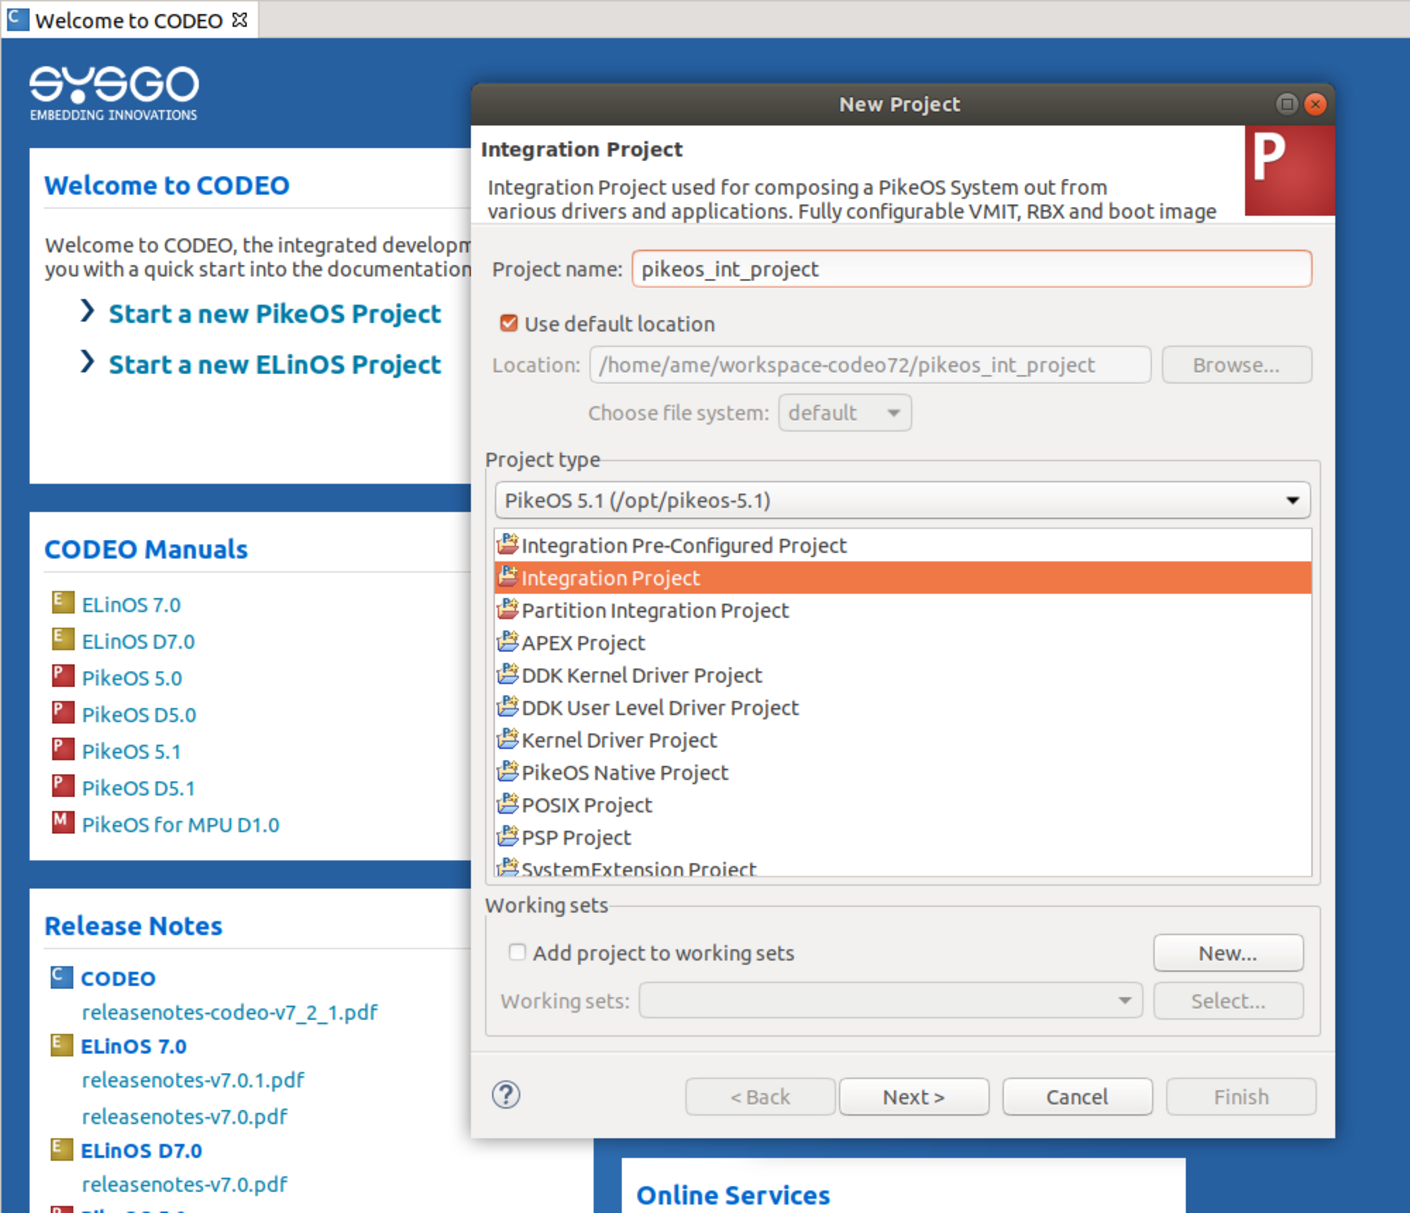
Welcome Screen with New Project Wizard opened for PikeOS
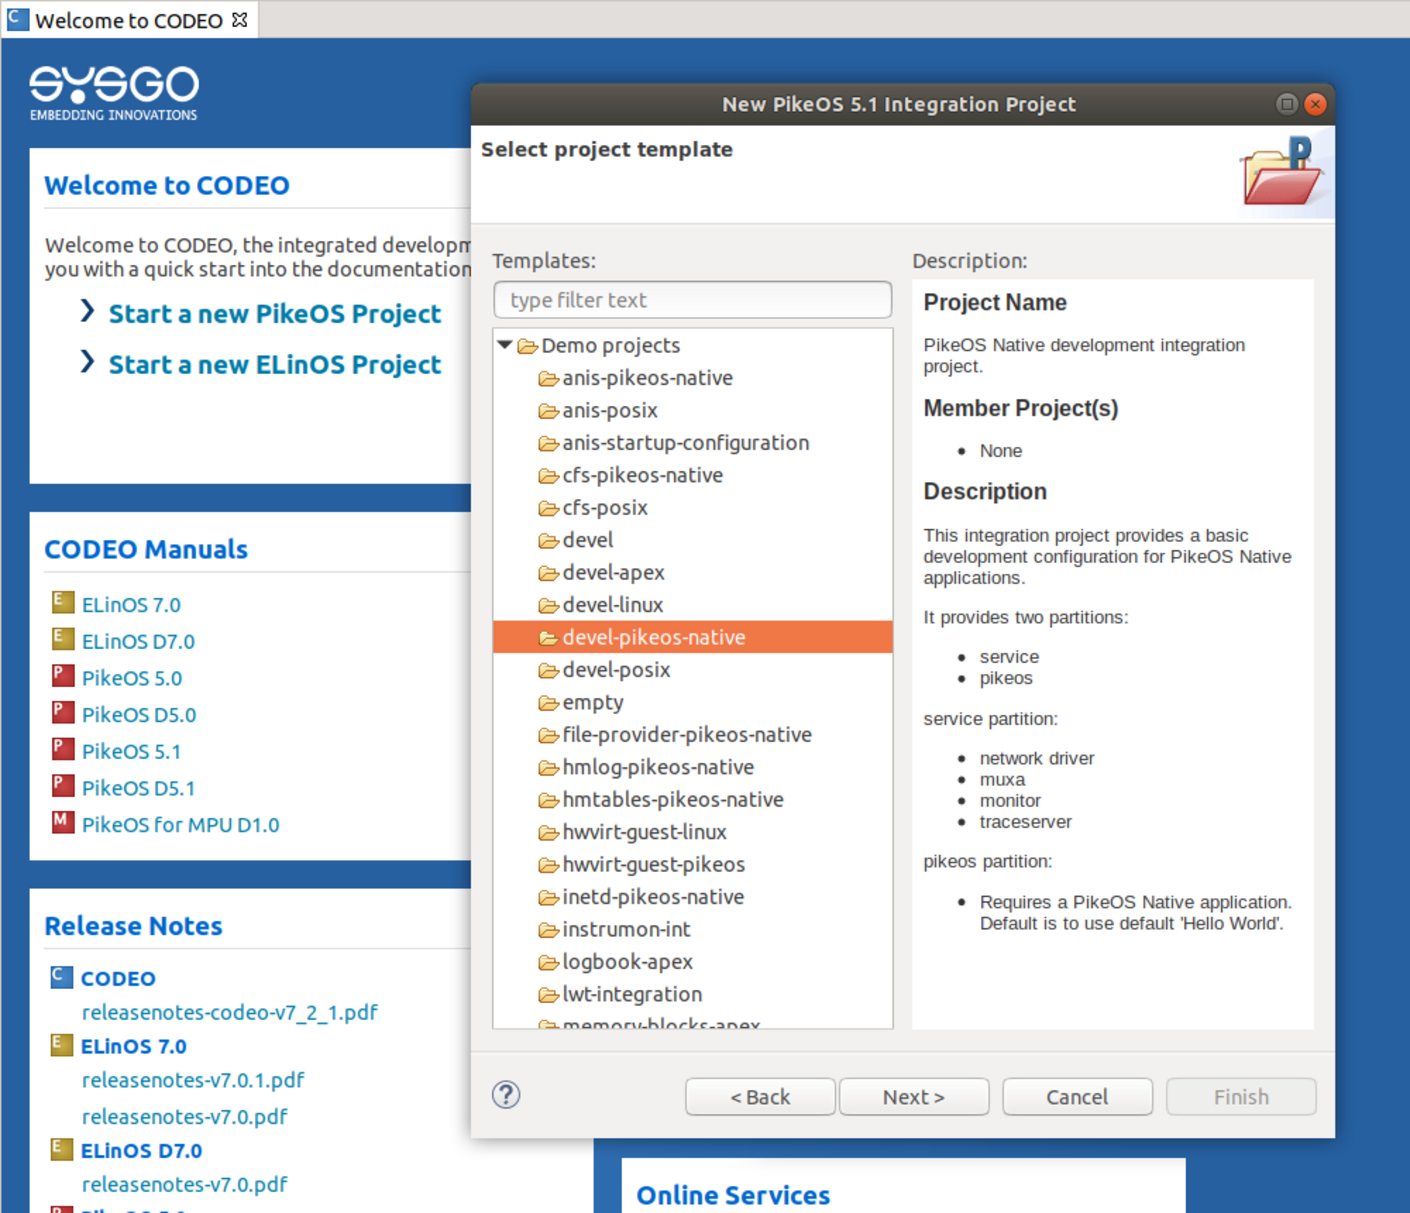
Welcome Screen, New Project Wizard, Demo Templates displayed
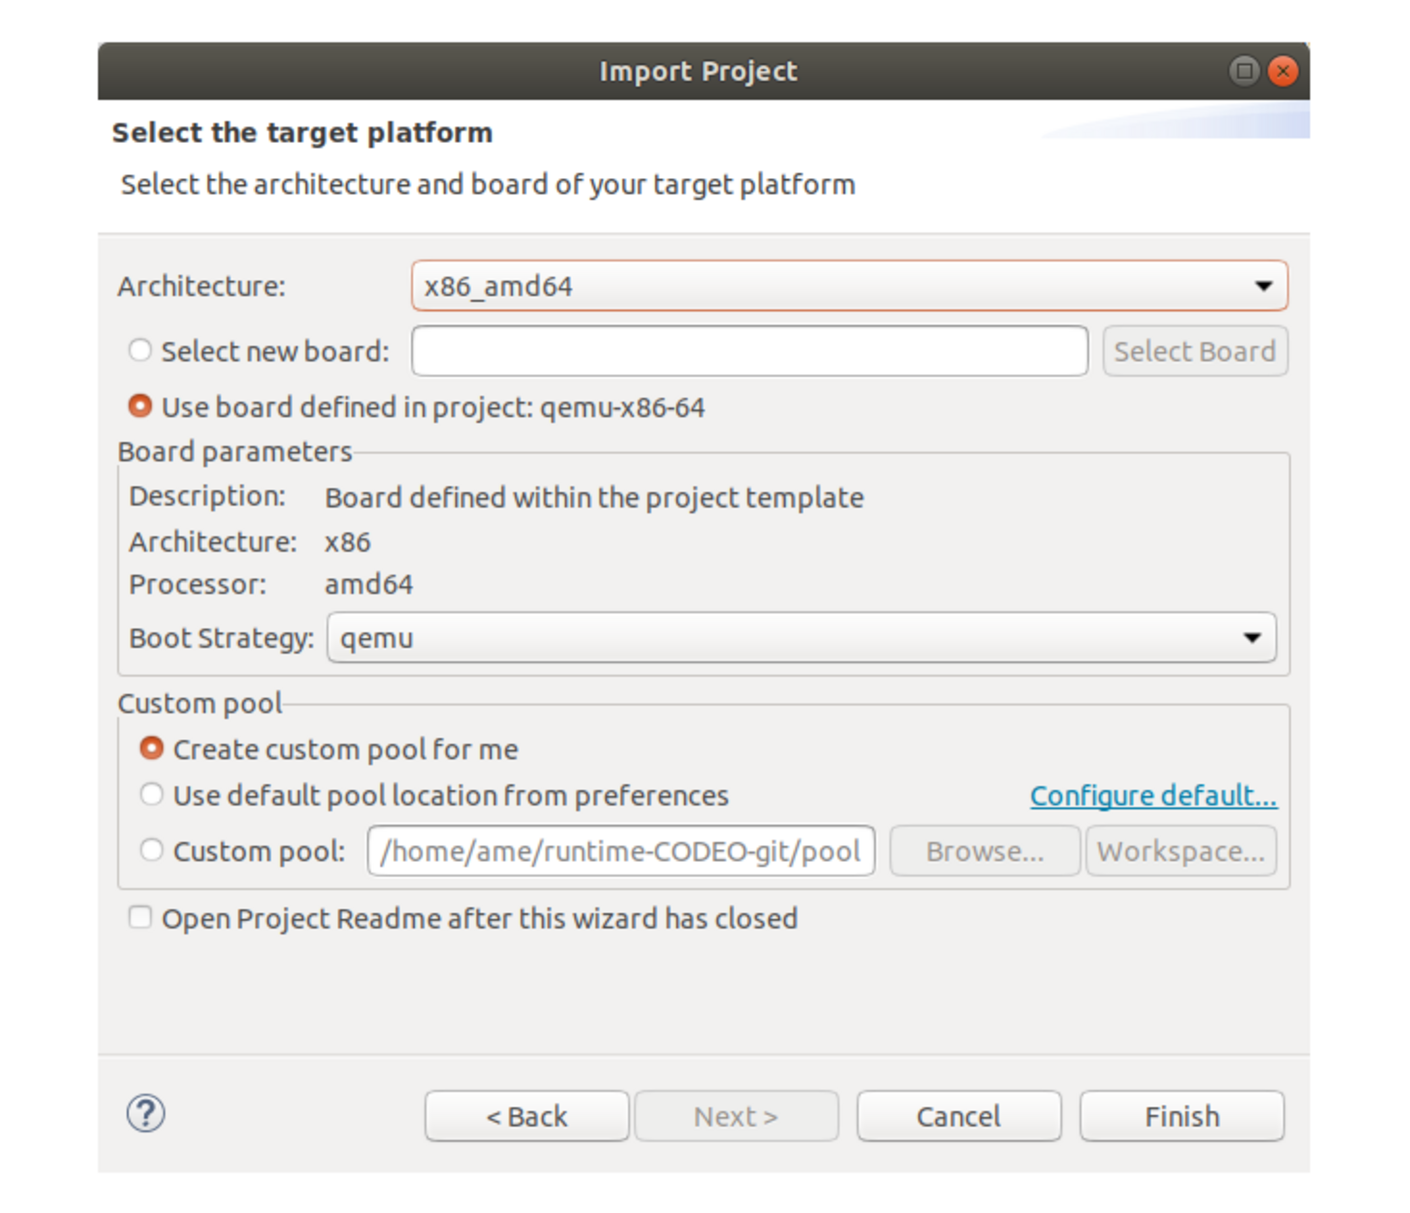
Wizard for Import PikeOS Projects into CODEO IDE, BSP selection dialogue
Configuration
Define your partitions (aka virtual machines) with the high-level configuration editor at a high abstraction level and fine tune every detail with virtual machine initialization table editor and the ROM Image Builder.
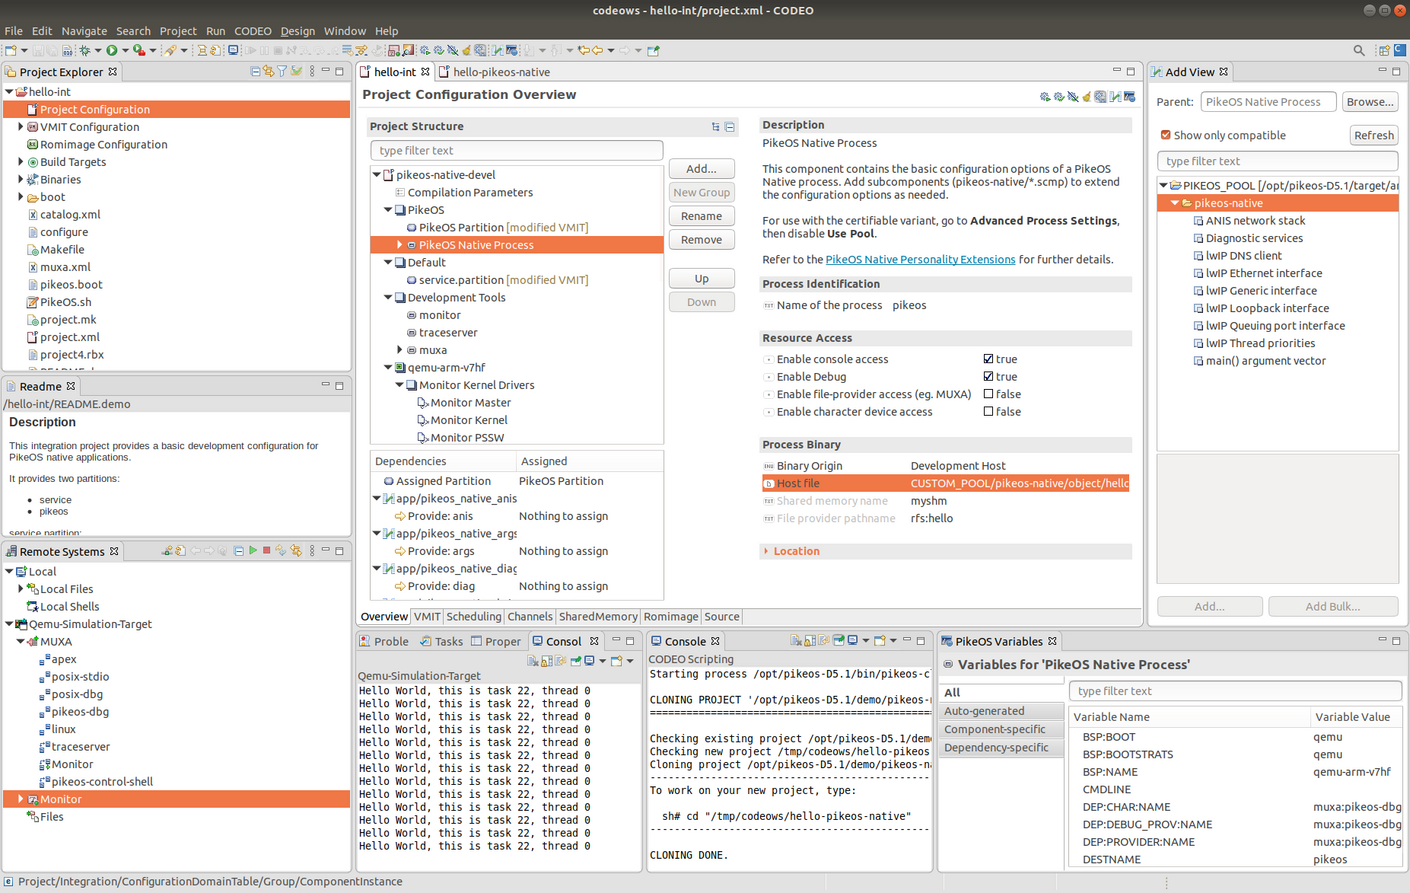
CODEO Project Configurator
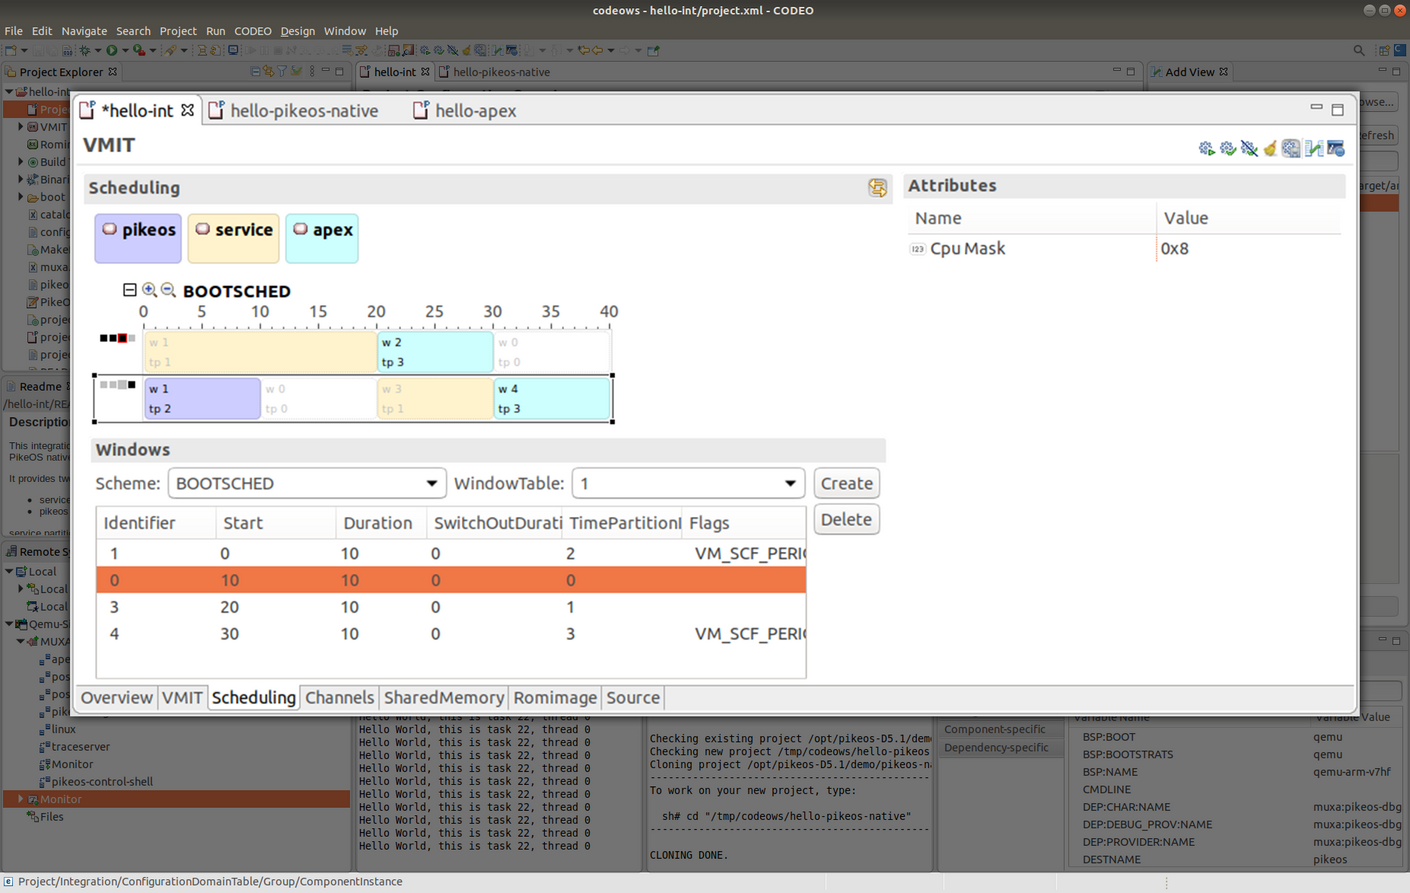
Scheduling Schema for SMP
Debugging & Analysis
SYSGO has rich experience with complex system behaviour when it comes to multiple operating system running on the same hardware. We know the common pitfalls and how to detect and fix them. Therefore, we are providing enhanced tools to assist you in understanding the interactions on your custom setup.

Remote Deployment and Debugging
Convenience tools to help you speed up the most repetitive tasks. All of the C/C++ Development Tooling (CDT) debugging views are supported remotely.

Static Analysis
View details of your running partitions on the remote target with the PikeOS monitor. You can also control your system and start/stop partitions independently from each other.
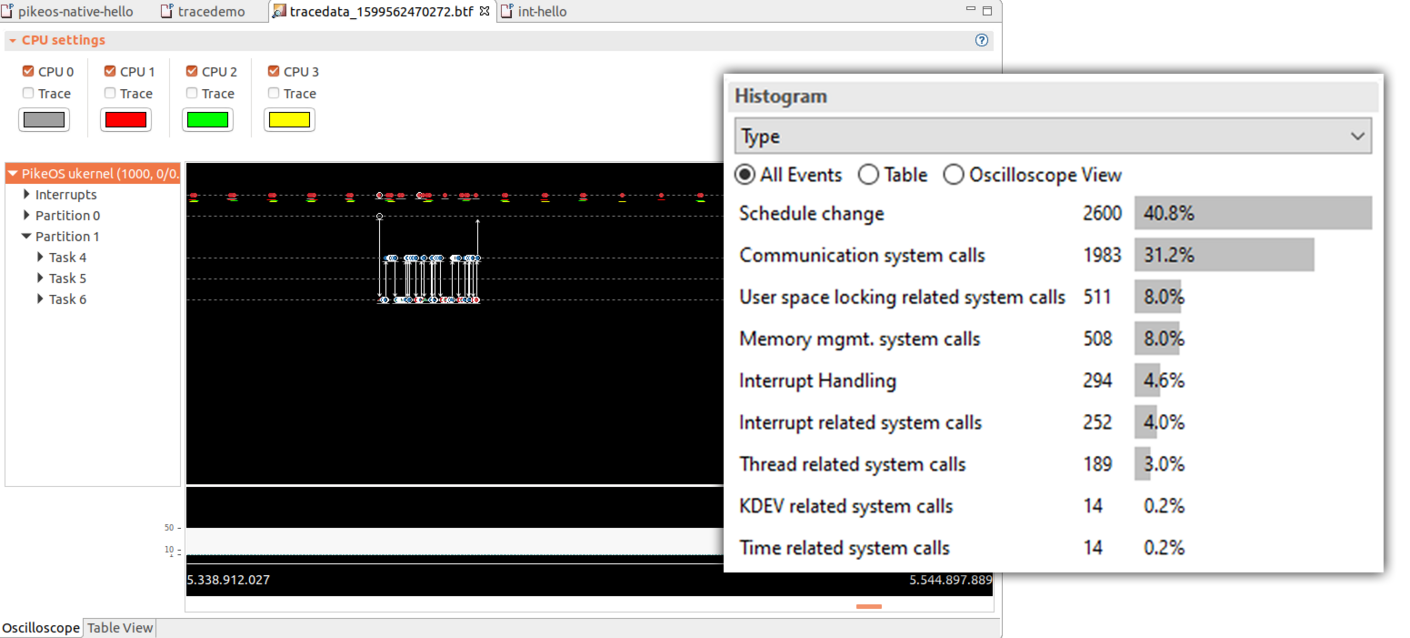
Oscilloscope simple Trace Tool Data with Statistic Information
Trace Tool
Capture dynamic events that raising from your system. For example, you can measure the time when an interrupt occurred or when the scheduler takes action. It is a powerful tool to find errors difficult to detect by a conventional debugger. Whereas a debugger needs to stop a thread for inspection, event tracing is minimally invasive. The source of the events ranges from the PikeOS kernel itself, from application level as well as used defined events. There are also trace tool kits providing awareness for all of our supported guest operating systems. Events can be filtered and searched and there is a configurable graphical display that shows the system dynamics in an oscilloscope-like screen.
